Summarise the information by selecting and reporting the main features, and make comparisons where relevant.
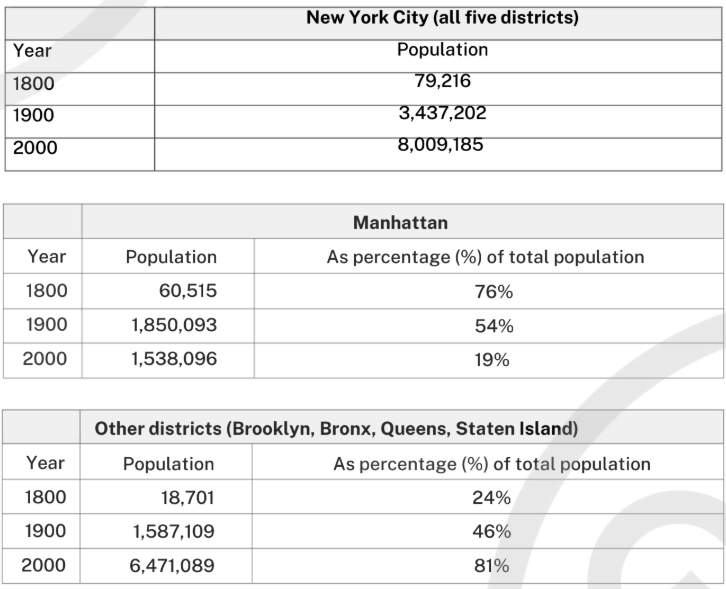
The first table presents changes in the total population of New York City from 1800 to 2000. The accompanying pie charts illustrate how the population was distributed among the city’s five boroughs—Manhattan, Brooklyn, the Bronx, Queens and Staten Island—over the same period.
Overall, New York City experienced substantial population growth across the two centuries. At the same time, while Manhattan initially accounted for the majority of residents, its proportion declined considerably, whereas the combined share of the other boroughs increased.
With regard to the total number of inhabitants, the city’s population rose dramatically from just 79,216 in 1800 to 8,009,185 in 2000. This represents an extraordinary expansion, reflecting the city’s transformation into a major urban centre.
In terms of population distribution, Manhattan was by far the most densely populated borough during the nineteenth century, accommodating the vast majority of residents. However, by 2000, this pattern had reversed. Manhattan’s share had fallen sharply to 19%, while the remaining four boroughs collectively accounted for 81% of the total population. This shift indicates a clear movement of residents away from the city centre towards outer districts over time.
It's helpful